Make a COVID-19 dashboard using Streamlit
Introduction
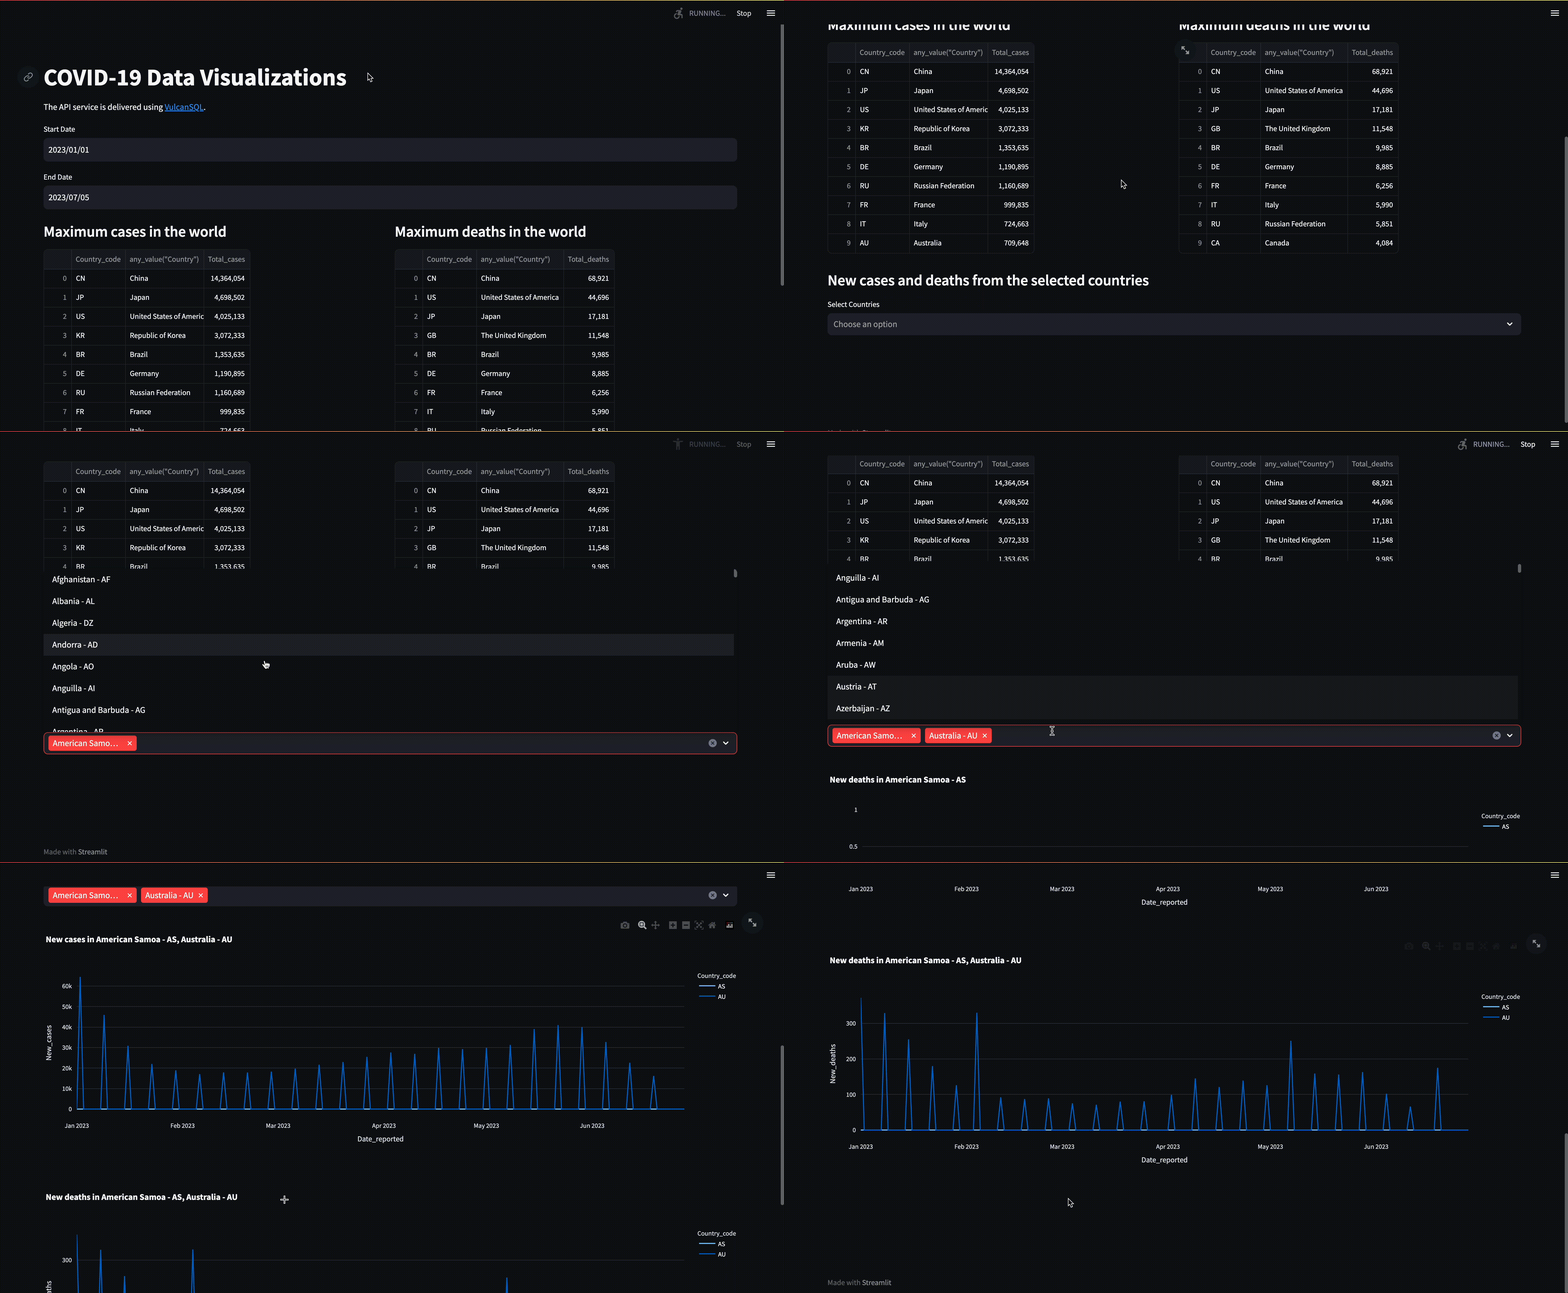
In this example, we'll demonstrate how effortlessly VulcanSQL can create and share data APIs. This allows data users to craft their own data visualization applications using different tools, like Streamlit, which is used in this example. The final product will be an interactive data visualization as shown below, and you can check API documentation and data dashboard demos here.

The Difficulties
If you're trying to share data APIs straight from your data warehouses or data lakes, you might find it complex and challenging.
- You need to select and get familiar with a programming language and a server framework or library.
- You need to grasp and put into action many API best practices. These include API documentation, rate-limiting, pagination, Cross-Origin Resource Sharing (CORS), as well as user authentication and authorization, etc.
Why VulcanSQL
VulcanSQL is a Data API Framework that helps data folks build and share scalable data APIs using SQL templates without any backend skills required.
- VulcanSQL uses the power of DuckDB as a cache layer. This mix helps cut costs and gives a big performance boost, making it a great fit for scenarios with lots of traffic and need for fast responses, where traditional OLAP database systems fall short.
- VulcanSQL has API best practices built in, like auto-generated API documentation using OpenAPI, rate limiting, pagination, and Cross-Origin Resource Sharing (CORS). This lets you focus more on implementing business logic.
- VulcanSQL ensures data privacy with features like user authentication and authorization, and data masking, etc. This gives you better control over how your data is used.
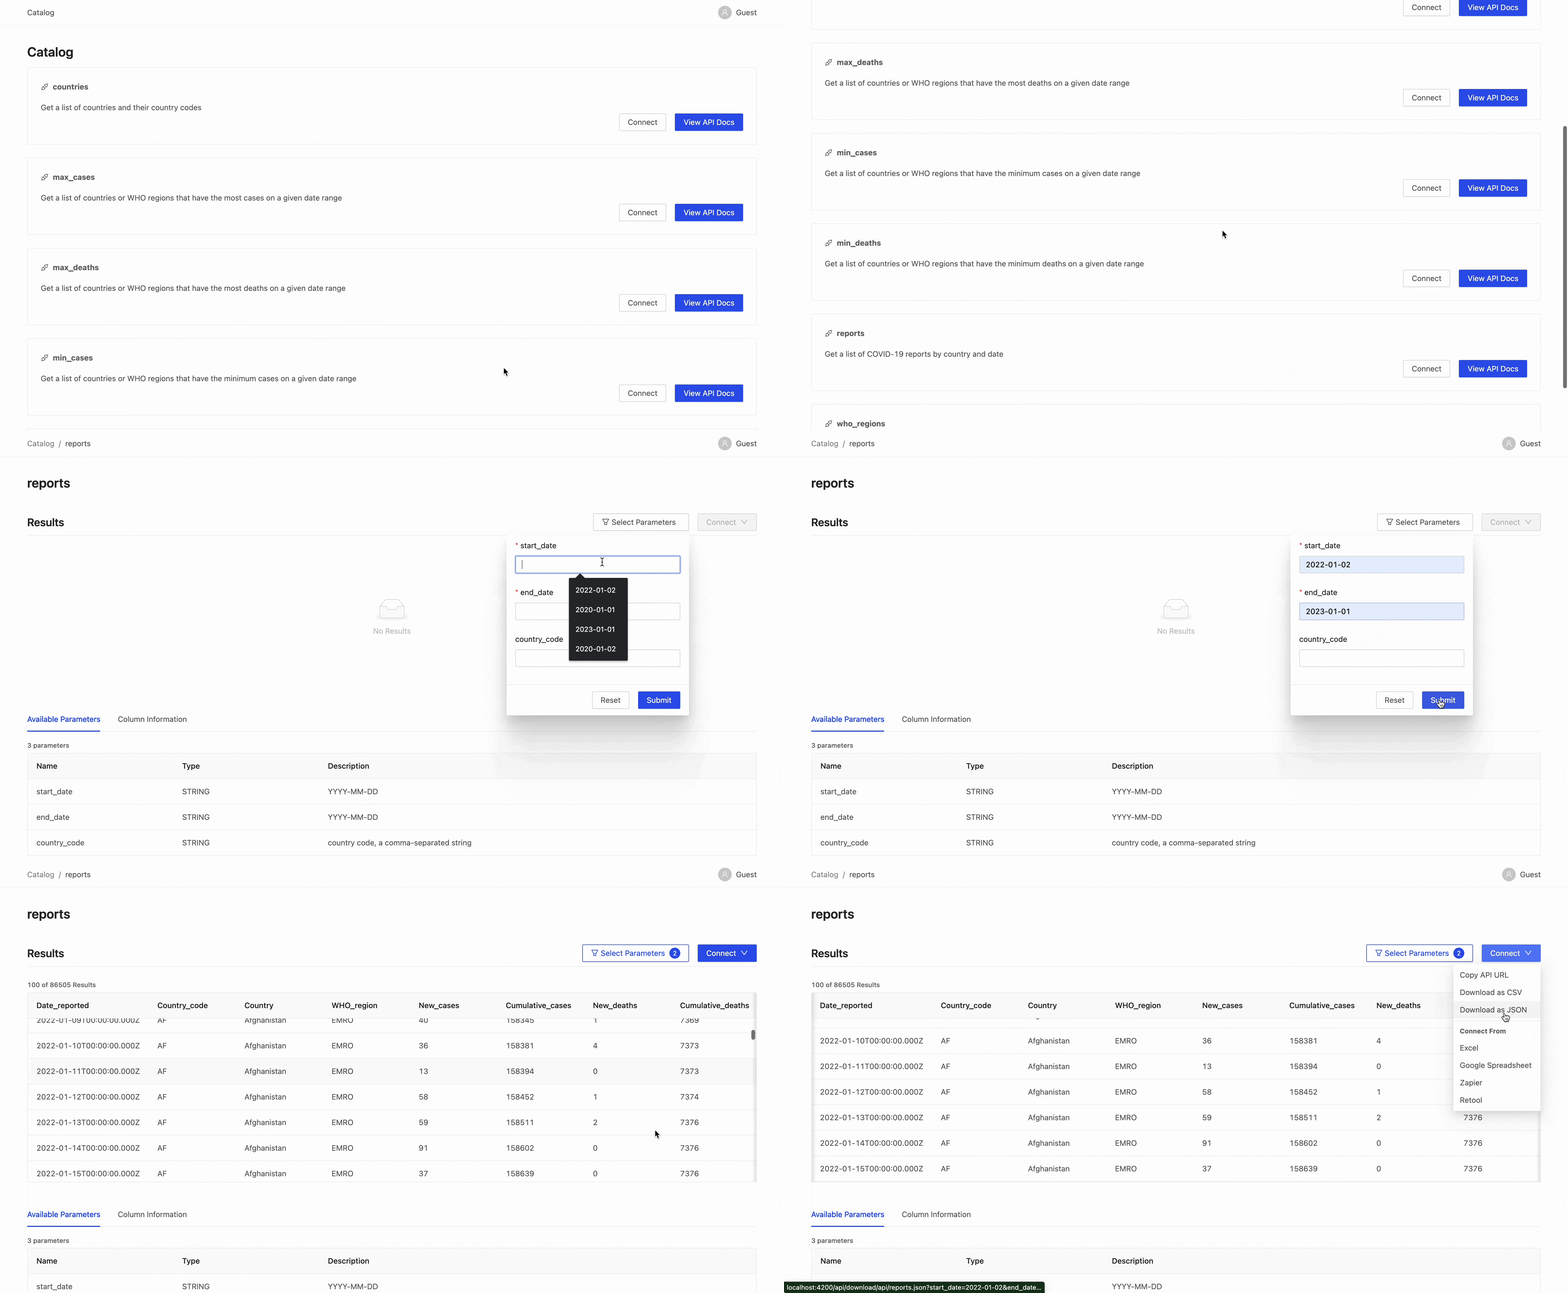
- VulcanSQL comes with API catalog designed to be user-friendly for non-technical users. This enables them to explore your API endpoints effortlessly and establish connections with downstream applications such as Excel, Google Spreadsheet, Retool, among others.
Demo: VulcanSQL + Streamlit
We are going to use COVID-19 data from WHO, and the data is in CSV format. We try to have a simple setup here to demonstate how it is easy to create and share data APIs using VulcanSQL, so we download the data set and feed data directly into DuckDB. It's also a perfect scenario if you have a data warehouse in the cloud, then you can directly feed data to VulcanSQL, and use DuckDB as a caching layer.
All of the source code is open source and on GitHub. Feel free to check it out!
What does the dataset contain?
The dataset we will use is daily cases and deaths by date reported to WHO. You can read detailed information in the link given above. The table below shows what each field means in the dataset:
| Field name | Type | Description |
|---|---|---|
| Date_reported | Date | Date of reporting to WHO |
| Country_code | String | ISO Alpha-2 country code |
| Country | String | Country, territory, area |
| WHO_region | String | Regional Office for Africa (AFRO), Regional Office for the Americas (AMRO), Regional Office for South-East Asia (SEARO), Regional Office for Europe (EURO), Regional Office for the Eastern Mediterranean (EMRO), and Regional Office for the Western Pacific (WPRO) |
| New_cases | Integer | New confirmed cases. Calculated by subtracting previous cumulative case count from current cumulative cases count |
| Cumulative_cases | Integer | Cumulative confirmed cases reported to WHO to date |
| New_deaths | Integer | New confirmed deaths. Calculated by subtracting previous cumulative deaths from current cumulative deaths |
| Cumulative_deaths | Integer | Cumulative confirmed deaths reported to WHO to date |
Designing API endpoints
After inspecting dataset, I figured out several use cases that data consumers may be interested to know and designed seven API endpoints as following. Also I will give further detailed explanation on one of API endpoints.
/countries: Get a list of countries and their respective country code/who_regions: Get a list of WHO regions/max_cases: Get a list of countries or WHO regions that have the most cases on a given date range/max_deaths: Get a list of countries or WHO regions that have the most deaths on a given date range/min_cases: Get a list of countries or WHO regions that have the minimum cases on a given date range/min_deaths: Get a list of countries or WHO regions that have the minimum deaths on a given date range/reports: Get a list of COVID-19 reports by countries and date range
Inspecting one of API endpoints
Now let's see how one of API endpoints is written in SQL using VulcanSQL. If you are reading this post right now and have never tried VulcanSQL before, I encourage you to check Create Your First Data API or view a demo hosted on Codesandbox.
After you inspect how you can generate API endpoints using VulcanSQL, let's see how SQL is written in /reports:
{% set country_codes = context.params.country_code %}

SELECT * FROM read_csv_auto('WHO-COVID-19-global-data.csv')
WHERE
    Date_reported >= {{ context.params.start_date | is_required }} AND
    Date_reported <= {{ context.params.end_date | is_required }}

    {% if country_codes %}
    AND Country_code IN (SELECT UNNEST(string_split({{ country_codes }}, ',')))
    {% endif %}
We accept country_code, start_date and end_date as query parameters.
- The
country_codeparameter accepts a comma-separated string, accommodating multiple countries that users may wish to explore. We leverageUNNESTandstring_splitfunctions to extract these values effectively. - The
start_dateandend_dateshould be provided in the 'YYYY-MM-DD' format.
In short, VulcanSQL utilizes SQL and Jinja to help you create APIs easily, and the SQL syntax you use depends on what database you connect to at the moment. Take this project for example, I use DuckDB as the database, so SQL syntax you've seen is based on DuckDB.
What is API Catalog and why
Despite creating API endpoints easily using SQL, VulcanSQL also has an extension called API Catalog, which enables data consumers to inspect and use your API endpoints easily, to help enable the dream of self-service analytics. The short video below shows how it works for data consumers:

What is Streamlit and why
In this example we use Streamlit to demo how VulcanSQL can be used, and you can definitely try other data visualization tools if you wish. Any tools that can ingest data using API endpoints are good candidates!
We choose Streamlit because it is a great tool for Python developers if they want to create a data web app for quick sharing. Feel free to inspect the source code of Streamlit part if you are interested!
Deployment
After creating and testing your API endpoints in your local environment, we can deploy them to the public now! We use Fly.io as the deployment option, since it offers the free deployment service and we can adjust the configuration parameters to prevent apps from hibernation! Welcome to check further details here if you are curious!
Conclusion
We hope that this example excites you and makes you want to try out VulcanSQL.
We have a Discord community and welcome to ask us anything or give us feedback! Also, we definitely welcome you to share interesting projects you've done using VulcanSQL in #showcase channel!
Finally, if VulcanSQL resonates with you, please consider starring us on GitHub!